As part of the broader research on histories of child soldiers in Africa, we are engaging with the existing monitoring of children in armed conflict internationally, including the reports of the Secretary-General of the United Nations and the United Nations Office of the Special Representative of the Secretary-General on Children and Armed Conflict. We anticipated that this would be a good way to link our historical project with contemporary prevalence data. We have found that the prevalence data is also useful for revealing the processes of humanitarian knowledge construction and norm evolution. This blog series contains methodological reflections and critiques founded in our unfolding attempt to construct our own historical dataset of children in armed conflict.
The main data page, where we discuss the mapping methodologies and sources, is here.
As we explored in the first blog of this series of humanitarian data, attempts to quantify the number of child soldiers and other related grave violations have produced data categories that are inconsistent and numbers that are sometimes speculative. In the 2000s, reporting often relied on qualitative language – ‘reportedly’, ‘observed, ‘widespread’, ‘systematic use’ or locations and events to create an evidentiary assessment that did not require quantification. The pre-2000 advocacy documents in particularly reveal the challenges of gathering accurate quantitative data, with sources providing gross estimates and wide ranging approximate figures for the same conflict or series of events.
We have attempted to address this inconsistent and approximate data by creating a scale of ‘intensity’, on the basis of estimates and qualitative descriptors, which can help us visualize the recruitment and use of children in armed conflict in different ways. This scale – which plots years of the reported conflict from 1-5 based on estimated prevalence of children used in conflict roles – enables us to bring quantitative and qualitative data types together in one map. Here we only address data on children’s military ‘recruitment and use’. Other blogs will address data on other violations, particularly in relation to ‘abduction’.
Scale
1 “Tens” (1-99)
2 “Hundreds” (100-999)
3 “Thousands” (1000-9,999)
4 “Tens of thousands” (10,000-99,999)
5 “Hundreds of thousands” (100,000+)
Methodology
For early advocacy reporting, which estimated total numbers of child recruits across all years of a given conflict, we have divided the highest estimated total by the number of years. Example: Angola, 1998-2002, estimated 16,000 children divided by 5 years = 3,200, assigned ranking of 3, “Thousands”. Data from UN monitoring (Secretary General Reports, 2002-2022) was coded on the basis of verified numbers per calendar year. In cases where verified numbers were conclusively inaccurate (such as no verified cases but the report documented observed use of children in military roles by armed groups), a default coding of 2 (“Hundreds”) was applied.
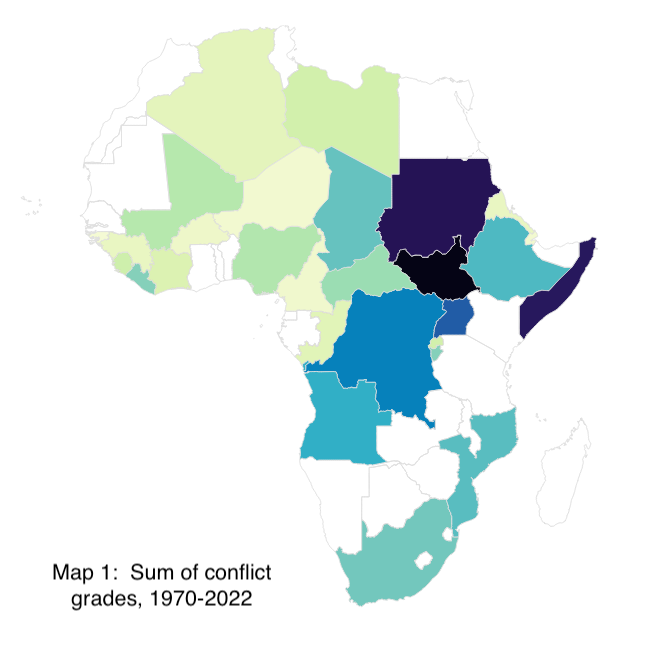
Map 1 is our first effort at mapping the intensity of child soldier usage, based on humanitarian monitoring data produced by the emerging and evolving coalition to aid children in armed conflict from 1970-2022. The colour gradient reflects the sum of the scale – enabling us to account for both the intensity of reported recruitment and the duration of reporting.
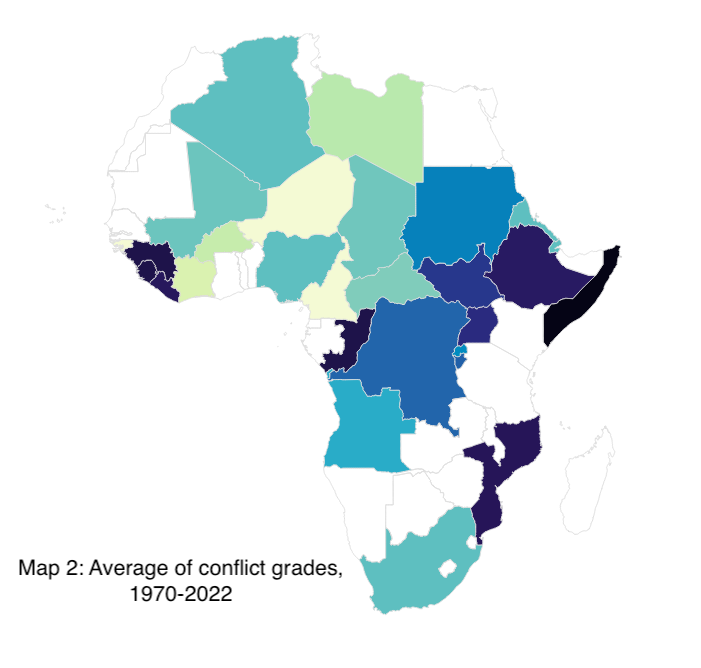
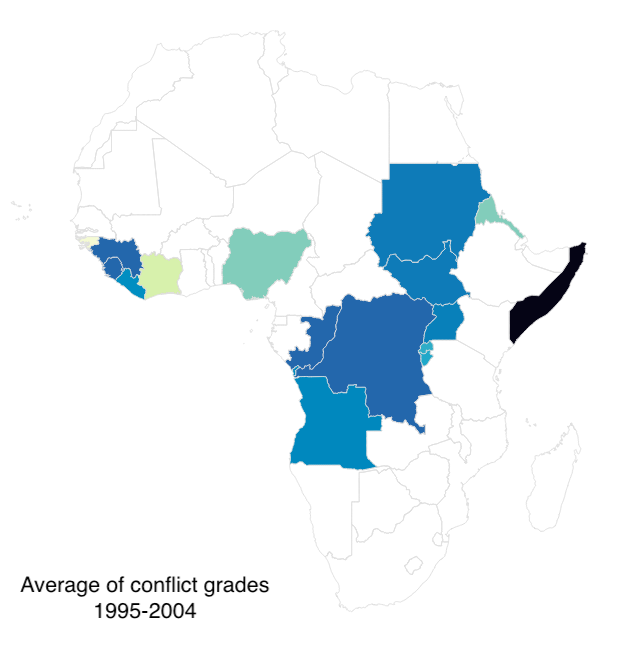
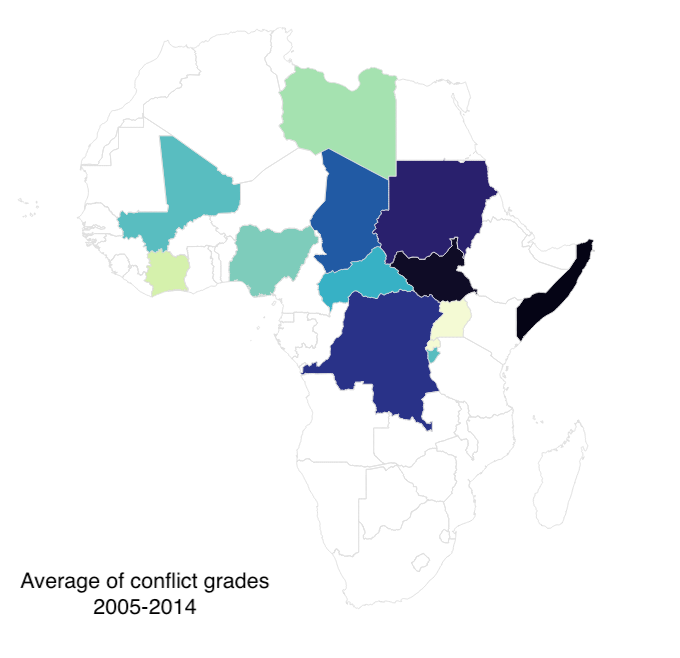
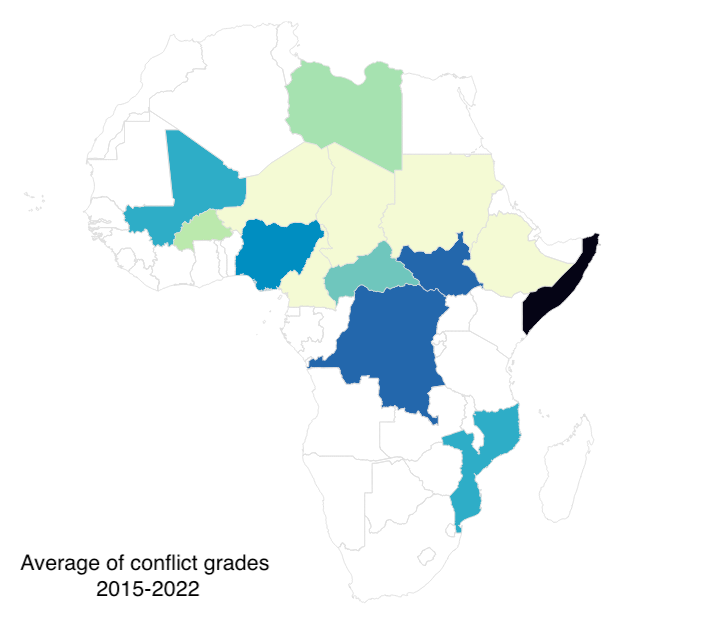
This map uses the same grading scale but averages the grades across years rather than aggregates them.
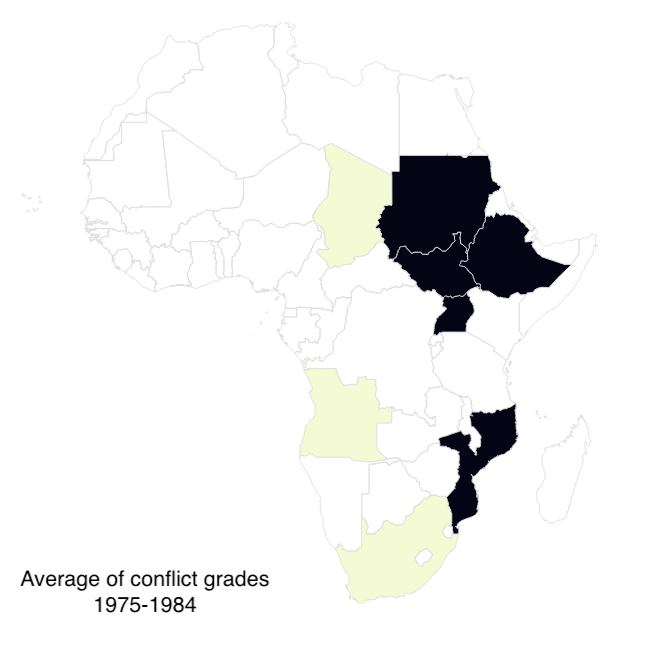
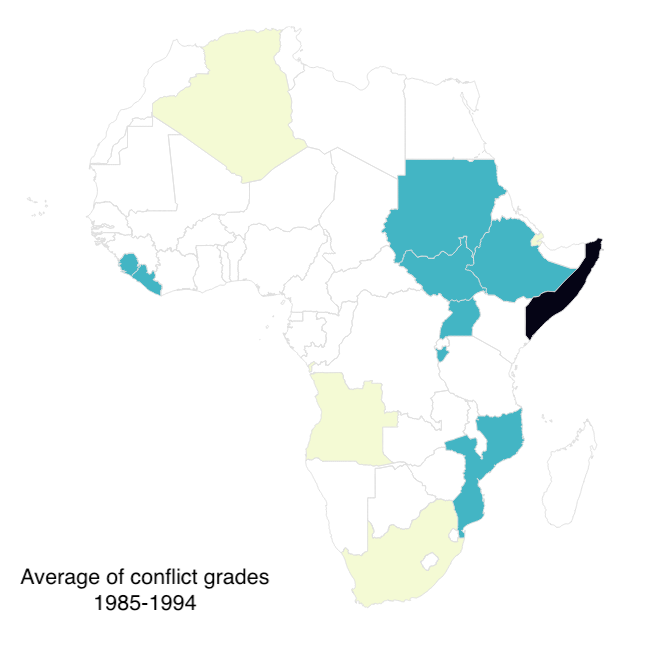
In contrast, Map 2 uses the same grading scale but averages the grades across years rather than aggregating them. This gives a different insight into patterns of children’s military use in conflict. This map visually identifies humanitarian reporting ‘hot-spots’. These are the countries where underage recruitment was most reported, and which therefore shaped the construction of the category of the ‘African child soldier’. Liberia, Uganda, Somalia, and Mozambique all stand out for their intensity, while the DRC and South Sudan, where child soldiering was more protracted but often less high profile, are somewhat eclipsed. When we disaggregate the data over time, such as in the 10-year segments visible in the map series below, we can start to visualize trends in recruitment and use across time.
In a subsequent blog series, we will explore these trends further across conflict registers – decolonial war, cold war conflicts, ‘new wars’ and the war on terror to consider the evolution and spread of child soldiering as a tactic across African conflicts. In a separate thread, we will consider how numbers and language intersect in the data through the lens of ‘abductions’.
Phoebe Shambaugh & Chessie Baldwin